
April Falls?
Has the market bottomed, or are we in a bull trap?

Let’s start with what this article isn’t. This isn’t another macro breakdown or a deep dive into how global markets are all interconnected. That’s not the goal here.
Instead, I want to focus on what’s actually happening on the chart, highlighting key areas in price action across Bitcoin price action and sharing how I’m interpreting them. This is something I’ve spent a long time doing, and honestly, it’s one of the parts of the market I enjoy the most. So let’s get into it.
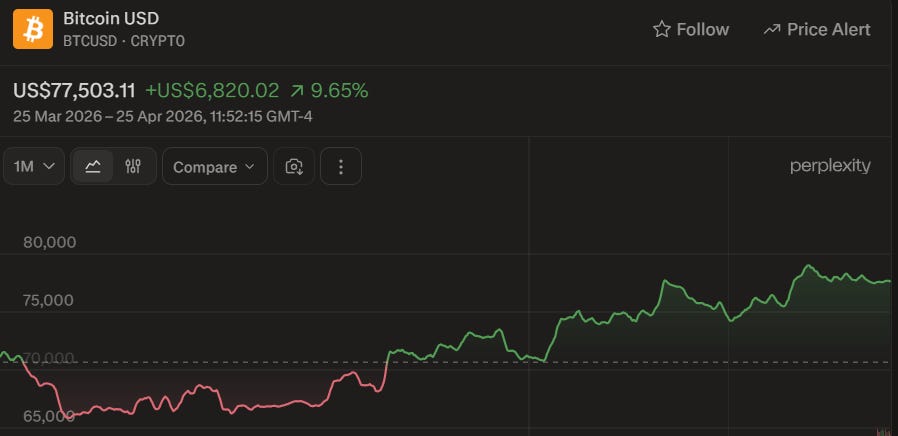
Unless you’ve been completely switched off, you’ll know Bitcoin went through a pretty heavy correction starting back in October, with the price pulling back around 52% over roughly 120 days.
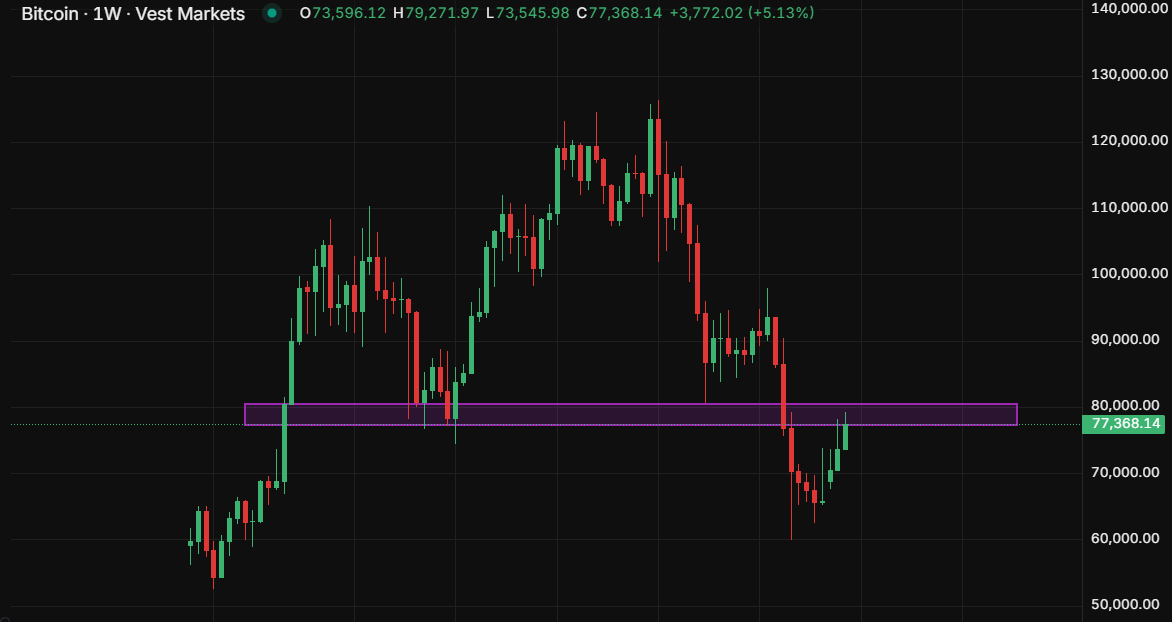
But when you zoom out and look at the weekly chart, something stands out pretty clearly: most of these moves don’t happen gradually; they happen fast.
Bitcoin tends to spend a lot of time chopping around within a range, only to then break out aggressively in one direction. That move is usually followed by another period of consolidation… and then the cycle repeats.
So what’s actually driving that?
At the core of it, it comes down to liquidity.
Markets move because buyers and sellers step in and place orders. That interaction fills the order book and ultimately determines where price goes. And within that, you can start to pick up signals, how aggressive participants are, how much size is coming through, and whether positions are being built or unwound.
Are participants scaling out slowly? Rotating from stables into BTC? Increasing exposure at key levels?
You don’t always know the exact intention behind every order, but what you do know is that it’s real capital entering or exiting the market. And that’s what moves price.
Another major driver of price sits outside of the spot market's derivatives.
Perpetual futures allow traders to buy or sell the future price of Bitcoin without an expiry date. In most cases, these positions are taken using leverage, giving traders increased exposure with less capital upfront.
But that leverage comes at a cost.
When you introduce leverage, you also introduce liquidation risk. Exchanges need a way to manage positions that move too far against traders, especially during periods of volatility. So when a position starts to get close to its liquidation level, systems begin stepping in to reduce or close it.
Where this starts to really matter for price is through the relationship between futures and the underlying spot market.
During periods of imbalance, when the majority of traders are leaning heavily in one direction, market makers often have to step into the spot market to hedge or balance exposure. That’s when derivative activity begins to directly influence price.
Because of this, perpetual futures data can give a really strong read on short-term sentiment.
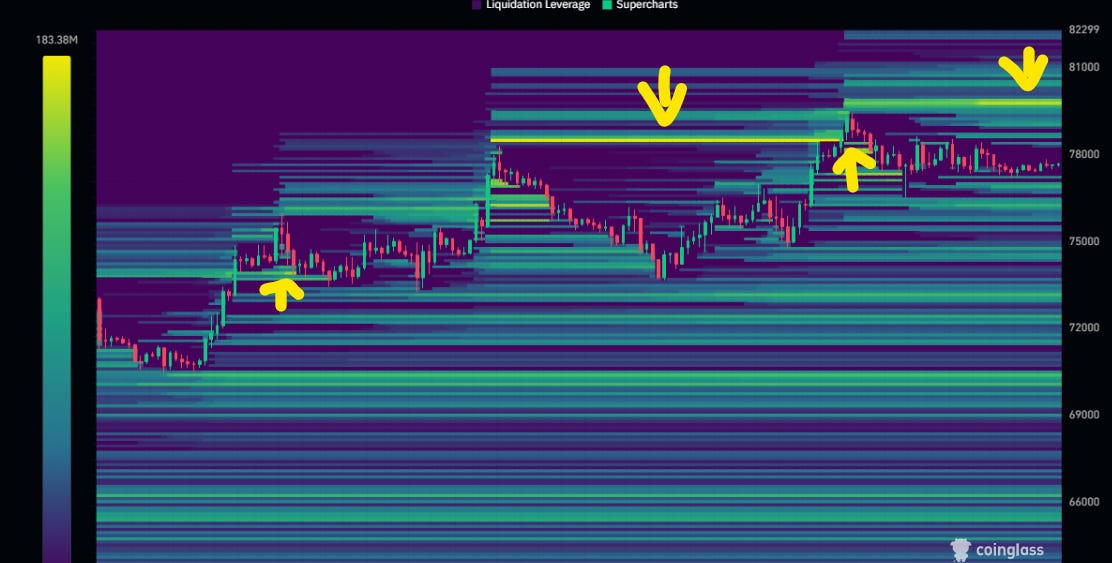
For example, if Bitcoin is trading at $77,000 and you can see heavy positioning building around $76,000 on the futures heatmap, it suggests that traders are stacking into longs, often with high leverage.
Now, does that mean I want to get long as well?
No, and this is where it gets interesting.
If anything, it tells me where the market is vulnerable.
Looking at the weekly range between $77,300 and $80,430, this is the kind of environment where positioning matters more than direction.
As we mentioned earlier, leveraged positions come with liquidation mechanics. While the exact process varies slightly by exchange, many platforms begin reducing positions before full liquidation—often when margin levels start to get tight.
So instead of one clean “liquidation price,” what you actually get is a zone where positions begin to unwind.
And when a large number of traders are positioned the same way, that unwind can happen fast.
Remember we highlighted that perpetual futures have an inbuilt liquidation feature? Right, this feature differs from exchange, but in most cases, when a trade is close to the point of liquidation, say near 80%, some of the top perp platforms have an automatic system in place that starts to work the liquidation order on the book, reducing the size of the position as the price falls to 100% of the liquidation quote.
This is where things start to get interesting.
Funds are not just “wiped out” at a single price. Instead, they’re gradually reduced as the price approaches liquidation levels, meaning that in heavily leveraged environments, you get cascading effects. One forced seller becomes many, and that’s where volatility expands rapidly.
So going back to the example: BTC trading at $77,000 with visible liquidity building around $76,000 on the long side. What this tells me isn’t that price is going higher; it tells me that there is now a pocket of vulnerability sitting just below price.
And markets tend to move towards vulnerability.
If price starts to drift lower, those leveraged longs begin to feel pressure. As liquidations kick in, that selling feeds into further downside, triggering more liquidations, and before you know it, you’ve got a sharp move that looks sudden on the chart, but in reality was building quietly through positioning.
This is why I don’t blindly follow crowded setups.
Instead, I’m asking: where is the pain point?
Because price often seeks out areas where it can do the most damage in the shortest amount of time.
Now, tying this back to the broader structure we mentioned earlier, Bitcoin’s tendency to compress within ranges before expanding aggressively, this liquidity dynamic is often the fuel behind those expansions.
You’ll typically see the following:
A period of consolidation
Increasing leverage build-up on one side
Liquidity clustering above or below range
Followed by a sharp move that clears that liquidity
And once that move happens, the market resets. Positioning gets flushed, volatility cools, and we move back into another phase of consolidation.
Looking at the current range between $77,300 and $80,430, this is exactly the kind of environment where I’m paying close attention to positioning rather than prediction.
Breakouts don’t happen in isolation, they happen because something underneath the surface gives way.
So rather than asking, "Is BTC going up or down from here?” the better question is:
Where is the market most exposed?
Because that’s often where price is headed next.
I appreciate that we have just taken a bit of a detour if you were expecting a short write-up on my views of where Bitcoin is going next, but these products are having more of an impact on the market as they gain in popularity, and they are doing so at a rapid rate. Just this week we had announcements that prediction markets are jumping into the world of perps. On to Price.
The weekly view on Bitcoin highlights another important fact, and that is Bitcoin has not spent much time within the 74,000 to 84,000 price range. When Bitcoin first broke past 69k back in 2024, it had an enormous move to the upside, breaking to 108k. In fact, before this year, Bitcoin had spent fewer than 2 continuous weeks trading below 80k. No time to fill the order book. So with thin liquidity, volatility expands. Now this time is different. Bitcoin has spent the majority of this year in a downtrend and, in most metrics, is still in a downtrend. If you follow a guru or furu on social media, they might be hesitant to say ‘we are back’ and still have a macro view that Bitcoin is heading lower.
This view changes, in my opinion, but it requires Bitcoin’s weekly candle to open and close above 80,430 and then open and close the following week above it. This gives a macro trader the confidence that Bitcoin has strength over a longer period of time. Bitcoin is already trading above the 50-day moving average and sitting 10% higher is the 200 SMA. Systematically the 200-day moving average works as a magnet, and with Bitcoin looking to close out 4 straight green weeks in a row, short-term traders will be wanting to target the 200 in order to take profits on this recent rally.
So that’s it. Let’s keep it simple. This is the best approach in my view, as we are in a very headline-driven market; one tweet from a guy sitting on a golden toilet and all of the TA and long analysis go out the window. It is my aim, then, to keep the 'what happens next in crypto’ rundown short.
On the support side, $73,400 is in play, and any strong break below $69,000 wipes out any uptrend Bitcoin has established over the last 30 days. At that point we can highlight more downside targets, but for now a near $10,000 is appropriate in my view.
There we have it, some upside targets on Bitcoin, some downside targets as well if support breaks, and also a side mission in liquidity on-chain as well as highlighting the role that perps now play and their impact on markets.
I have been partnered with VestExchange for a while now, as they are bringing equities into the world of perpetuals. They also have VestCapital, which brings funded accounts to the world of perps with some generous payout structures, so if either of these two features appeals to you, I have a discount code to share on an evaluation for a funded account; you can use code CAM50 to get 50% off of your eval. Also follow the link here to open a free account.
https://trade.vestmarkets.com/join/58008